
Mapping Extreme Heat in Salt Lake City
By Mark Johnston
We’ve grown accustomed to seeing vehicles stacked with sensors on our city streets and highways, from Google Street View cars cluttered with cameras to parking enforcement vehicles scanning license plates.
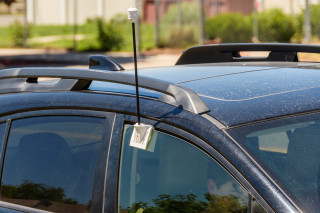
Yet there are many more that go under the radar. This summer, privately owned vehicles took to the streets in Salt Lake City sporting discreet antennas that were tracking and mapping one of the valley’s pressing concerns: rising heat.
Like with other natural disasters, the impacts of extreme heat are not evenly distributed among city residents, with certain areas of the urban landscape seeing much hotter temperatures than others. This is due partly to the fact that urban greenspaces play a big role in mitigating heat, with vegetation and tree cover offering cooling effects among the many square miles of concrete.
However, historically disadvantaged neighborhoods are more likely to lack these greenspaces and their cooling benefits, making for more inhospitable conditions in the heat of summer. This can result in a higher occurrence of heat related illnesses among residents or outdoor laborers, and a greater strain on the energy grid as more power is required to cool buildings.
Identifying the disparities of heat distribution in our community has never been done in detail until this year.
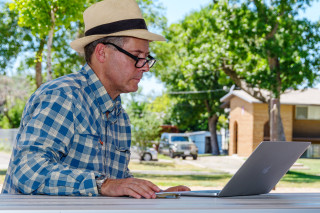
“Urban heat can be hard to escape in the summer, and I’ve always been aware of places with fewer trees being hotter than those places with more trees,” said Ellen Eiriksson, NHMU’s citizen science program manager, who was a participant in the mobile heat monitoring study in Salt Lake City over the summer.
The collaboration between local scientists, city managers, policy makers, and 42 volunteer data collectors produced the SLC Heat Watch Report, a 25-page analysis of Salt Lake City’s Urban Heat Island effect. More specifically, the report illustrates where heat is distributed in our community to help identify neighborhoods at greater risk in a warming world. It is part of the CAPA (Climate Adaptation Planning + Analytics) Heat Watch program, a NOAA-funded initiative that is conducting mobile heat monitoring in more than 60 communities to identify the inequitable impacts of urban heat. Like NHMU’s citizen science initiatives, CAPA Heat Watch is a community science campaign that builds on local partnerships and engages residents in the study—but being selected as a participating city is no easy feat.
Salt Lake City was chosen as a candidate after acceptance of an application spearheaded by Rob Wilson, who teaches the Climate Science Class at Rowland Hall. Following the alarmingly hot summer of 2021, Wilson worked with his students, the Utah Climate Center, and the Salt Lake City Government to assemble a credible team and clearly outline the needs of the city. Their application to CAPA Heat Watch was submitted to NOAA in late 2022 and in April 2023 Wilson received some good news.
“It was a thrill to be selected. NOAA told us it was highly competitive process to be an awarded city,” Wilson said.
With that good news came a laundry list of assignments and work commenced immediately. NOAA had the protocol for conducting the study, and they even provided a subcontractor to help facilitate it. The rest was up to Rob and his team, who designed and rehearsed 10 routes for mobile monitoring across the city, identified the best date for data collection, and recruited 42 volunteers—including Eiriksson—to drive the routes.
On Saturday, July 15, they took to the streets and slowly crisscrossed Salt Lake City on predetermined routes in three exact time windows, from 6–7 a.m., 3–4 p.m., and 7–8 p.m. Temperature and humidity data points were collected along the way, and a total of 58,707 measurements were then delivered to CAPA analysts for processing with a machine learning model.
The results were delivered as thermographic maps of Salt Lake City that show the heat distribution across the region at three distinct times of day, with a fourth map showing an average area-wide model. As one might expect, the heat across the city varies by the quality of land, with cooler temperatures recorded along the elevated east bench, at the mouths of canyons, along creeks, around city parks, and along the shaded Jordan River Corridor. Meanwhile, hotter temperatures turn large swaths of the map a deep orange in the central and western valley until the reaches of rural landscape beyond the airport.
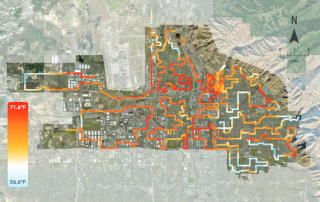
It's a high-definition visualization of the regions in our city that will be most impacted by rising heat, and it provides a compelling conversation starter exactly as designed.
“I think of citizen science as being a conversation between communities, scientists, and managers, and that’s exactly what this project is,” Eiriksson said. “These groups have come together to collect data on urban heat islands, and thanks to CAPA, we have maps that visualize this data in a way that is easy to digest. Now, community members and leaders can gather around that data and continue the conversation toward creating a safer, and more equitable urban environment.”
This is exactly what will happen Sunday, November 5, at NHMU when Eiriksson, Wilson, and other organizers from the Utah Climate Center, Utah State University, and Salt Lake City will host a data presentation to share the findings of the report. It will be a first step in validating the findings and generating interpretations that can help Salt Lake City prepare for a warmer future. Subsequent conversations will help identify vulnerability factors, calculate impacts on energy or public housing, plan for tree planting or resilience hubs, and discuss other intervention strategies to make our warming city safer for everyone.
For those who get involved, it will be a unique opportunity to act at a community level on the worldwide challenge of climate change.


