Data Visualization - Stay Curious, Utah!
Understanding and interpreting data is a critical science practice. Through the activities below students will be introduced to interpreting maps step by step. Practicing interpretation of maps of earthquakes and volcanic events help students understand different data visualization methods used by scientists.
Identify and Interpret (I2) Strategy
Graphs can feel overwhelming at first glance. Learn the Identify and Interpret Strategy from BSCS Science.
Data Visualization Activity
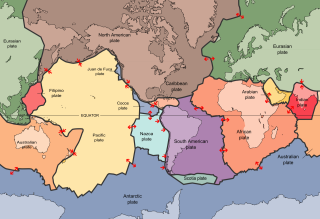
Begin exploration of maps and data to better understand earthquakes and volcanic activity.